About Company:
Dharmaj Crop Guard manufactures and deals in pesticides including concessionaires of public health products for pest control, insecticides, herbicide, fertilizers and allied products related to research and technical formulations.
They have an active portfolio of 190+ products, catering
to a wide customer base including bulk consumers, retailers and export customers.
Company has three business segments-
- Branded Formulations (B2C)
- Institutional Formulations (B2B)
- Active Ingredients (B2B)
Production Facility in Dahej:
- Technicals & Intermediates = ~8,000 MT
- Formulations Capacity = ~25,500 MT
Company also has a solar power plant of ~85,320 KW installed capacity, ~7,800 KL installed capacity of sewage treatment plant
Company has entered a new geographical cluster in South India, covering Odisha, Andhra Pradesh, Karnataka, and Telangana in FY’24
Company is present in 24 states with 20 stock depots, 5,000+ dealers and distributors and 15,000+ Retail touch points and is also present in 29 countries with 85 Export Market Product Registrations (202 in Pipeline)
Company supplies products to institutional customers in 29 countries across Latin America, East Africa, Middle East and Far East, etc.
Agrochemical Industry Overview:
Pesticides can be manufactured and sold mainly in two forms-
- Technical- Concentrated Chemical; unsuitable for direct use
- Formulations – Finished Pesticide
Formulations = Techincals + Formulants
China makes around 90% of the technicals used in the world and many Indian players are formulators who import technical pesticides from China and then produce formulations in India.
In Agrochemicals, we have innovator company (which have patent protection) and generic company. Most of the Indian companies are in generic molecules.
New Pesticide molecule takes about 10 years to its commercial use in farms.
Generic companies may take 3-5 years to register a generic molecule in US and around 1-3 years in India.
Key factors that affect entire industry-
- Seasonality – Demands depends on rain, pest attack, sowing season.
- Intense Competition – Due to low capital requirements for formulation and easy availability of technical pesticides from China.
- Low Pricing Power – Market for pesticides is low brand conscious and highly price sensitive.
- R&D requirements – Significant challenge of product obsolescence due to multiple reasons-
- Pests develop resistance to existing pesticides
- Ban of old version of harmful pesticides by government
- High working capital – Requires maintaining high inventory as well as a large amount of trade receivables.
- Risk from Organic Farming and Genetically modified Seeds – Most of the crops sowed in the USA for corn, cotton and soybean were genetically modified.
Market Size of key markets –
- North America (United States, Canada, Mexico) – $30-35 billion
- Latin America (Brazil, Argentina, Chile) – $20-25 billion
- Asia-Pacific (China, India, Japan, Australia) – $50-55 billion
Company Deep Dive-
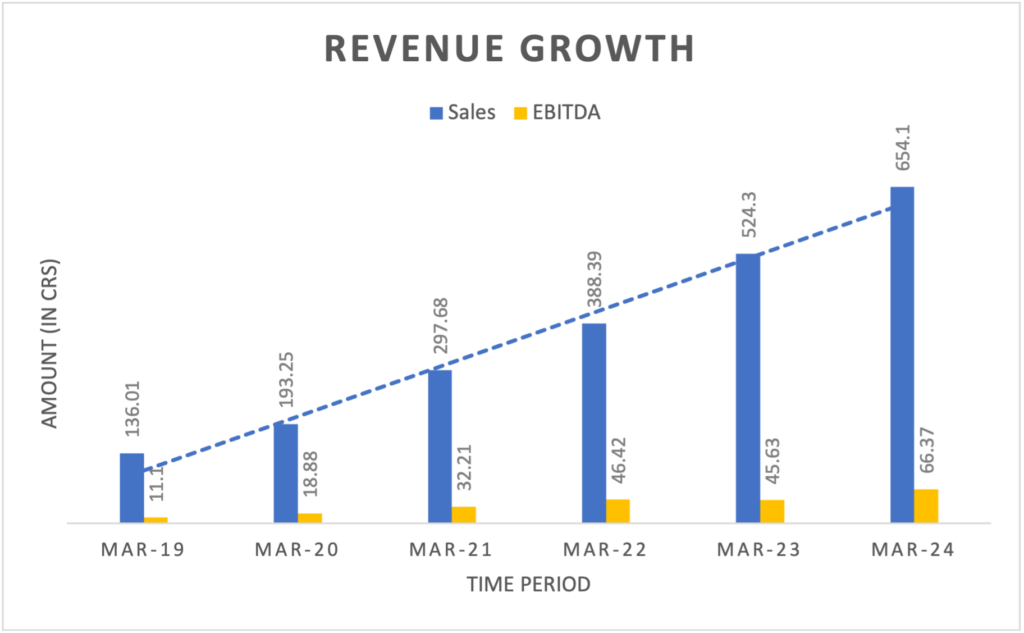
Company has grown their Sales by 37% CAGR and PAT by 55% CAGR in last 5 years on small base, while maintaining the operating profit margin around 9%.
Margin Profile of 3 Business Segments-
| Business Vertical | Gross Profit Margin | EBITDA |
| Branded Formulations | 30-35% | 14-16% |
| Institutional Formulations | 15-20% | 10-11% |
| Active Ingredients (New Vertical) | 30% | 15-18% |
Business Segments Analysis –
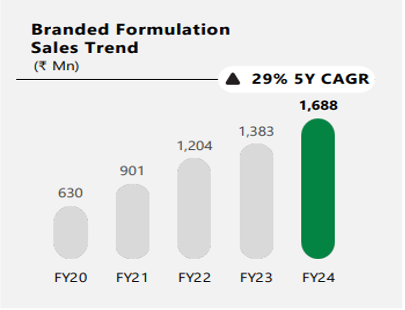
1. Branded Formulations –
- Contributes 26% to the total sales of the company in FY’24
- Company has 121+ products and 350+ SKUs and recently launched 7 new products in Q1’25
- Company has increased Retail touchpoints from 15K to 16K
- Company has tapped in South India region, namely Odisha, Andhra Pradesh, Karnataka and Telangana. Now company has presence in 24 states in the brand formulation business, which was 15 states in FY’21
- Company has grown On-ground sales & Marketing team by 50% compared to FY’21
- Management mentioned that Volume growth was greater than 50% but Value growth is around 25% in FY’24 due to lower prices
2. Institutional Formulations-
- Contributes 74% to the total sales of the company in FY’24
- Company has 250+ products to 700+ customers
- Company caters to both domestic and export formulations

3. Active Ingredients (New Vertical)-
Company has acquired land parcel on 99-year lease at Sayakha GIDC, Gujarat in Apr’19 and plant commissioned on Jan’23
Project cost was around 275 Cr, partially funded by IPO proceeds (₹ 105 Cr) and term loans
Potential 2 -2.5X Fixed Asset Turns at Optimum Capacity Utilization
Company is eyeing an average monthly production of 200 metric tons per month which should means around 30% capacity utilization in the first year
This vertical will add ₹ 150 Crore of revenue in FY’25 and ₹ 200-220 Crore in FY’26
Financial Analysis-
ROCE:
Return on capital employed (ROCE) is a financial ratio that can be used to assess a company’s profitability and capital efficiency. In other words, this ratio can help to understand how well a company is generating profits from its capital as it is put to use. Looking at the past 3 – 5 years average, they have a ROCE of around 23% and recently ROCE is depressed due to ongoing CAPEX.
Operating Margins and Future Margins:
As can be seen in the Annual P&L statement, the company is doing a good job in maintaining average margins of 9% in the last few years. Due to increase in sales in branded vertical (having gross margin of 30%) and foraying in technical manufacturing business for captive consumption and sales of technical. Management has guided increase of gross margin by 3-4% by FY’27.
Inventory Days:
The company has maintained the inventory days of around 60 days in the past which is around 150-200 days in industry (Rallis India, Sharda Cropchem, Dhanuka Agritech). This highlights company’s efficiency in inventory management.
PEG Ratio:
AT the CMP of Rs. 332, and TTM EPS of 12.56, the P/E ratio is around 26x. The growth in earnings in the last 12 months (TTM June ’23 vs TTM June ’24) is around 13% (43 cr vs 38 cr). So the PEG ratio comes to 26/13, which is 2 (optically high).
We need to account for incurred loss of -3 Cr in Q4’24 which had been impacted primarily because of Sayakha project commissioning (EBITDA loss of 7.3Cr), entailing higher depreciation, finance cost, and operating expenditure such as Employee Benefit Expenses.
Adjusted Q4’24 earnings = [7.3 Cr (EBITDA loss) + 3 Cr (Dep.) + 2 Cr (Interest)]*0.75 (tax adjustment) = 9.2 Cr
Adjusted TTM June’24 Earnings = 55.2 Cr
Adjusted PEG Ratio = 26/45 = 0.57 which is lower than 1
Debt to Equity:
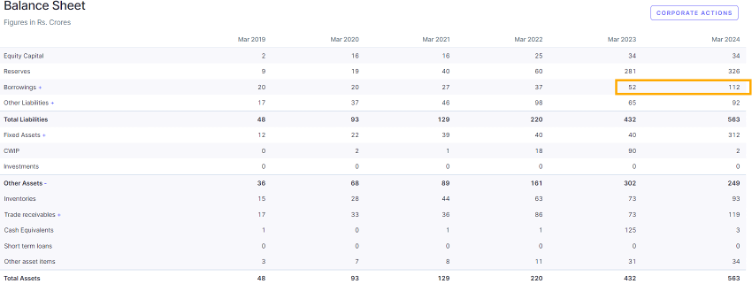
As can be seen from the extract below, the company has increased its borrowings substantially in the last 2 years from 37 cr to 112 cr in Mar ’24. This increase can be attributed to capex in new unit operationalized by the company at Sayakha, GIDC for Active Ingredients.
Looking at the D/E ratio = 112 cr/ 360 cr = 0.31. We are comfortable since it’s below 1.
Balance sheet extract
Management Analysis-
Rameshbhai Ravajibhai Talavia (Chairman, MD) has 3 decades of experience in agrochemical industry. He had worked at renowned organisations like Coromandel International. Leading overall business strategy at company.
Jamankumar Hansarajbhai Talavia (Whole Time Director) also has 3 decades of experience in agrochemical industry. Leading manufacturing and purchase processes at company.
FY’23 and FY’24 were challenging years for the Indian agrochemical sector, primarily due to high raw material costs and inventory build-ups. Additionally, low demand in the US and Europe also affected the industry’s players. Despite these tough conditions, the company managed to grow by 25%, while most of the other companies posted losses or a decline in revenue over the past two years. This growth underscores the management’s ability to navigate through difficult times effectively.
One year forward fair price calculation based on PE and EPS forecasting:
Management has guided for 25-30% growth in formulation business which will be around 900 Cr and 150 Cr will be coming from new Active Ingredients vertical in FY’25.
Similarly, 25-30% will be there in FY’26 over 900 Cr of formulation sales in FY’25 and 50 Cr additional sales from Active Ingredients vertical in FY’26
However, there will be 15 cr of EBITDA loss from Active Ingredients vertical in FY’25.
Tax Rate = 25%
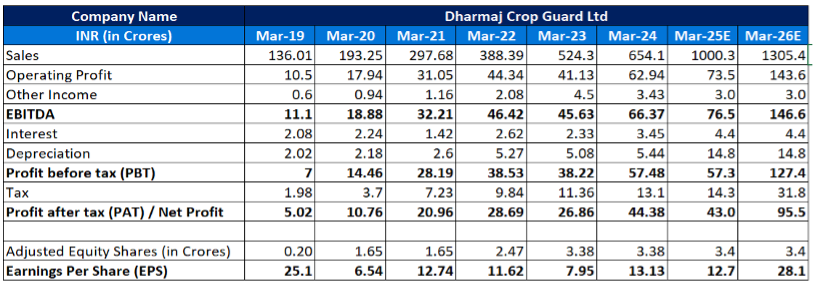
Expected EPS for FY’26 = Rs 28.1
Now coming to appropriate P/E we can do a simple relative analysis with peers in agrochemical space. There are multiple players in the industry like Dhanuka Agritech which has strong domestic presence and brand value, Bharat Rasayan. But volume growth is lower for these companies.
So considering the strong growth in the company, we feel an appropriate P/E to assign to Dharmaj can be 25 – 30x .
Based on the same, the Fair price for Dharmaj can be 700/- to 845/- in next 2-3 years.